Author: Kathiann Kowalski / Source: Science News for Students
Maybe you’ve heard the saying that “a picture is worth a thousand words.” It means that some information is best conveyed visually.
And that’s especially true in many research fields, says electrical engineer Dan Gardner.But what if you can’t see?
Dan’s dad learned firsthand just how hard some science work can be when he could o longer see pictures, graphs or other visual displays of his data.
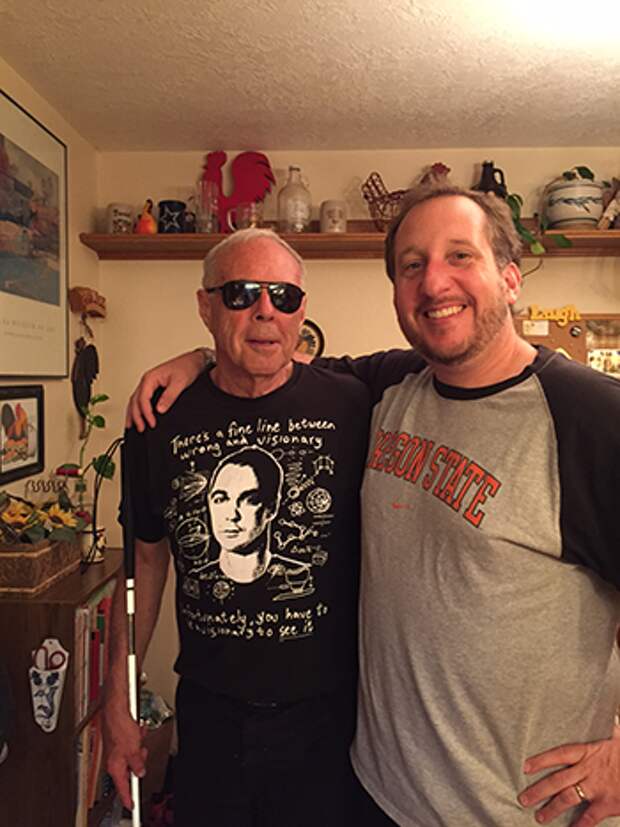
John Gardner was a solid-state physicist at Oregon State University (OSU) in Corvallis. His job involved using “the properties of the nucleus [of an atom] to learn something about the solid [state]” of materials, he explains. For many projects, he and his team added tiny bits of radioactive impurities — think of them as tags — to different solids and liquids. Then they applied a strong magnetic field to each material.
Energy from the “tags” would be released in the form of gamma rays — a type of radiation. The rays would be at right angles to each other. But there was also some wiggle, some variation in the angle of an emerging beam of energy. The wiggles came from other atoms in the material, which were all moving around.
“What we did,” John explains, “was to evaluate the wiggles.” That gave his team useful information about the materials they studied. Yet to do that took a lot of complex math. And it involved studying a lot of graphs.
Although blind in one eye, John could see with the other. Or he could until too much pressure built up from fluid in the good eye. He needed surgery. Unfortunately, his eye reacted badly. This left the scientist completely blind.
John still wanted to do physics. But to do that, he had to interpret each graph precisely. “Getting it exactly right all the time was incredibly important,” he explains. And that, he notes, “was not easy to do when I couldn’t see [those graphs].” Once he became blind, he had to approach things differently.
For a while, he still supervised graduate students. They would tell him what a graph showed. That helped somewhat. But he wasn’t satisfied. He wanted to more directly “see” those graphs and data that underpinned his work.
His solution: Design a system to make touchable data graphs and other “visual” aids for himself and others who couldn’t see well, or at all.
John got a team together at OSU. With financial help from the National Science Foundation (NSF), they invented a new type of printer for these data and graphs.
Braille is a form of printing for the blind. Raised dots take the place of printed letters. But regular braille couldn’t handle a lot of advanced math. It didn’t work well for scientific graphs and charts, either, John explains. People at NSF asked John if his team could invent a better way. He told them he thought so. Afterward, NSF gave his group funding to give it a try.
Together, John’s team worked to apply the concept of braille to math and visual data.
Their novel printer squeezes paper between pointy tools called punches and little cups, called dies. When the punches press into the dies, they make raised dots on the paper between them. This type of printing with raised dots is called embossing.
The team showed NSF how the concept worked. “They were absolutely blown away,” John recalls. NSF gave his group another grant for more work. And John moved from working on physics to working full-time on developing this technology. His new job: creating new tools for scientists with vision problems.
How to make data ‘show and tell’
John Gardner set up ViewPlus Technologies to make the new printers — and make them better.
For instance, the printers had to work with common software programs such as Word and Excel. They also needed to increase how many dots per inch, or DPI, the machine could emboss. The more dots per inch, the sharper and more detailed a graph or chart could be.
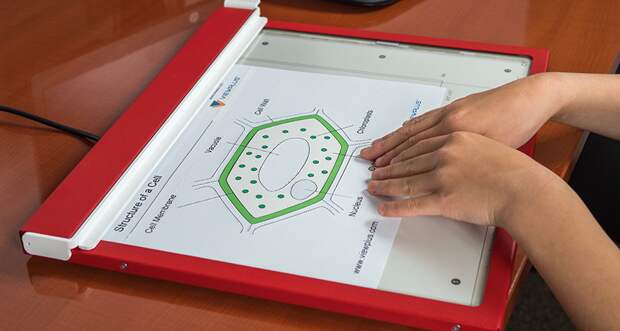
Users would also need to be able to tell different parts of a map or chart from each other. One bar chart might compare several groups in a study, for example. Someone might display this on a regular chart using different colors, shading or other visual patterns. John’s team had to figure out ways to display such contrasts. They decided on “shading” such regions using dots with different heights.
The team also has developed interactive “talking” pictures. This system combines a tactile (TAK-tyle), or touchable, printout with a computer to make interactive graphs and charts. One printer step embosses braille and graphics. Another adds visible ink. Meanwhile, a computer file for the graph has sound information coded for different parts of the image.
Now a sighted teacher or low-vision user can work with the same document. A person puts the tactile printout over a touchscreen. That touchscreen is hooked up to a computer, and the corresponding computer file is open. As someone touches different parts of the printout, this…
The post This printer makes ‘visual’ aids for people with sight problems appeared first on FeedBox.