Author: J.D. Roth / Source: Get Rich Slowly
Who am I kidding?
I can’t go an entire month without publishing anything here at Get Rich Slowly. I need to write. And judging from the feedback regarding my planned sabbatical, you folks want me to write! Tell you what, let’s change the premise.
Instead of taking all of September off from publishing, I’ll instead vow that for the next four weeks, I won’t tackle any major articles.
If there’s something that I want to share and that thing can be shared in 20-30 minutes, I’ll do it. This plan will serve the same objective — freeing my mind to focus on the other tasks that need to get done around here — while also giving me an outlet for my writing (and giving you something to read).Sound like a plan?
Instead of a “silent September”, we’ll have a “subdued September” here at Get Rich Slowly. Now and then, I’ll share some quick and interesting money stories.
A History of U.S. Bull and Bear Markets
Here, for instance, is a chart providing a succinct history of the U.S. bull and bear markets since 1926. (Click to open a larger version.)
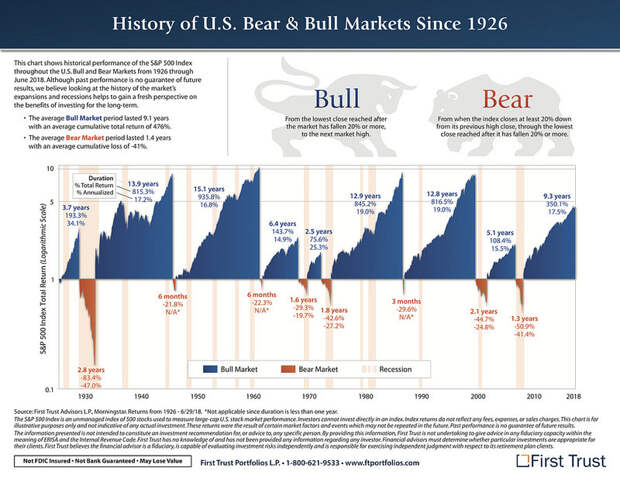
I love this chart! Produced by
The post A visual history of U.S. bull and bear markets since 1926 appeared first on FeedBox.